Adblocker detected! Please consider reading this notice.
We've detected that you are using AdBlock Plus or some other adblocking software which is preventing the page from fully loading.
We don't have any banner, Flash, animation, obnoxious sound, or popup ad. We do not implement these annoying types of ads!
We need money to operate the site, and almost all of it comes from our online advertising. If you want ad free viewing experience please subscribe at www.watchnews.pro
Please add planetnews.com to your ad blocking whitelist or disable your adblocking software.
According to the latest study released from the U.S. CDC (Centers for Disease Control and Prevention) on Thursday, approximately one-fourth of American adults are physically inactive. In addition, new CDC maps show that differences in the prevalence levels of physical inactivity in America exist by ethnicity/race and location.
A survey conducted by the national health agency of the U.S., CDC, and state health departments asked US citizens if they participated in physical activities like walking for exercise, running, gardening, golf, outside their regular occupation in the previous month. Nationwide, the prevalence of physical inactivity was 25.3 percent.
These new maps use combined data from 2017-20 for 52 jurisdictions – 49 American states, the Puerto Rico and Guam territories, and the District of Columbia. And the data for New Jersey weren’t reported amid no collection in 2019. Combining 4-years of data permitted analysis of the prevalence of physical inactivity among different ethnic/racial groups. Moreover, data from individual years are available through the Behavioral Risk Factor Surveillance System (BRFSS).
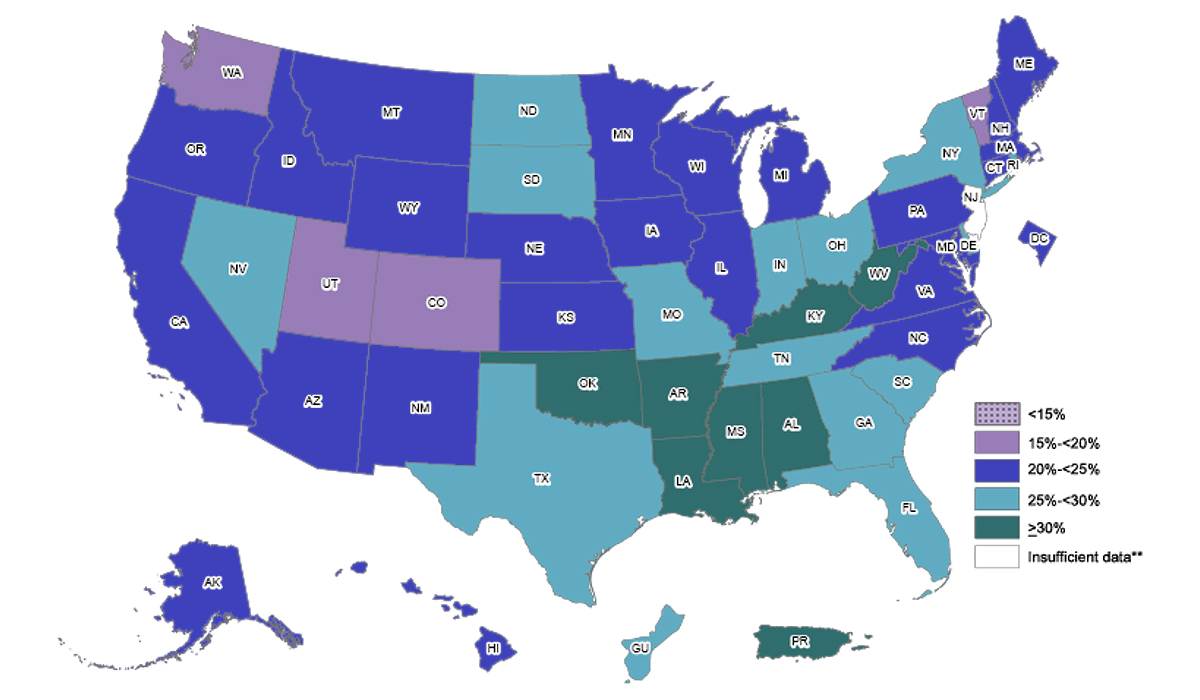
Location-Based Physical Inactivity Prevalence
The highest prevalence of physical inactivity was 49.4 percent (Puerto Rico), and the lowest prevalence was 17.7 percent (Colorado). Regionally, the South States – 27.5 percent – had the highest prevalence of inactivity, followed by 25.2 percent in the Midwestern States, Northeast – 24.7 percent, and 21 percent in the Western States.
The District of Columbia and twenty-four states had an inactivity prevalence of 20 percent to less than 25 percent.
Four states (Washington, Utah, Vermont, and Colorado) had a prevalence of physical inactivity of 17.7 percent to less than 20 percent.
Puerto Rico and seven states – Mississippi, Oklahoma, West Virginia, Alabama, Louisiana, Arkansas, and Kentucky – had a physical inactivity prevalence of thirty percent or more.
Guam and fourteen US states had physical inactivity of 25 percent to less than 30 percent.
Overall Physical Inactivity in America Source: Behavioral Risk Factor Surveillance System
Overall, non-Hispanic Asian adults had the lowest physical inactivity prevalence of 20.1 percent outside of the job. Non-Hispanic Black and non-Hispanic White had inactivity prevalence of 30% and 23%, respectively. Moreover, non-Hispanic American Indian/Alaska natives had a physical inactivity prevalence of 29.1 percent, and Hispanic adults’ 32.1 percent.
Physical activity can benefit everyone, but lack of access to convenient and safe places to be physically active might contribute to these ethnic and racial differences.
In the survey, the Centers for Disease Control and Prevention pointed to blockades to physical activity – a lack of safe locations to exercise, poor street infrastructure, unsafe parks and streets, a lack of time, or a lack of social support – as reasons for the ethnic and racial differences in physical inactivity.
An August 2021 survey that grasped answers from about 13000 people across 139 nations showed that the number of people who exercise 1-2 times a week amplified 88 percent during the deadly COVID-19 pandemic.
Moreover, the survey, which came from the running shoe-review firm RunRepeat, found a 14 percent decline in those who exercise at least times a week. This contrasts with some surveys from the early pandemic months, which showed people were performing physical activities less during confinement.


